Below are samples of work we have done in the past few years, for more information in any of them, please send your request to contacts@ileiry.com :
Corridor modeling
The theory was that, the climate in Madagascar would change in such a a way that temperature would rise, and precipitation would decrease. The phenomena would be more intense in the southern and south western Madagascar. This analysis tries to design and model a corridor for species survival and migration : animal would try to get higher in altitude where temperature would be cooler. This analysis combines animal habitat suitability, species interaction and behavior, and climate.
Management indicator
Oronjia is a new protected area created in 2012. This analysis aim to evaluate efficiency of conservation effort in the area. One of the most important indicators is forest cover. Using high resolution satellite images (SPOT 6 multispectral at 5m and panchromatic with a resolution of 1.5m), it is possible to create detailed forest cover map of the area. This is an ongoing analysis as forest cover would be evaluated each year to follow its evolution.
Deforestation analysis and modeling
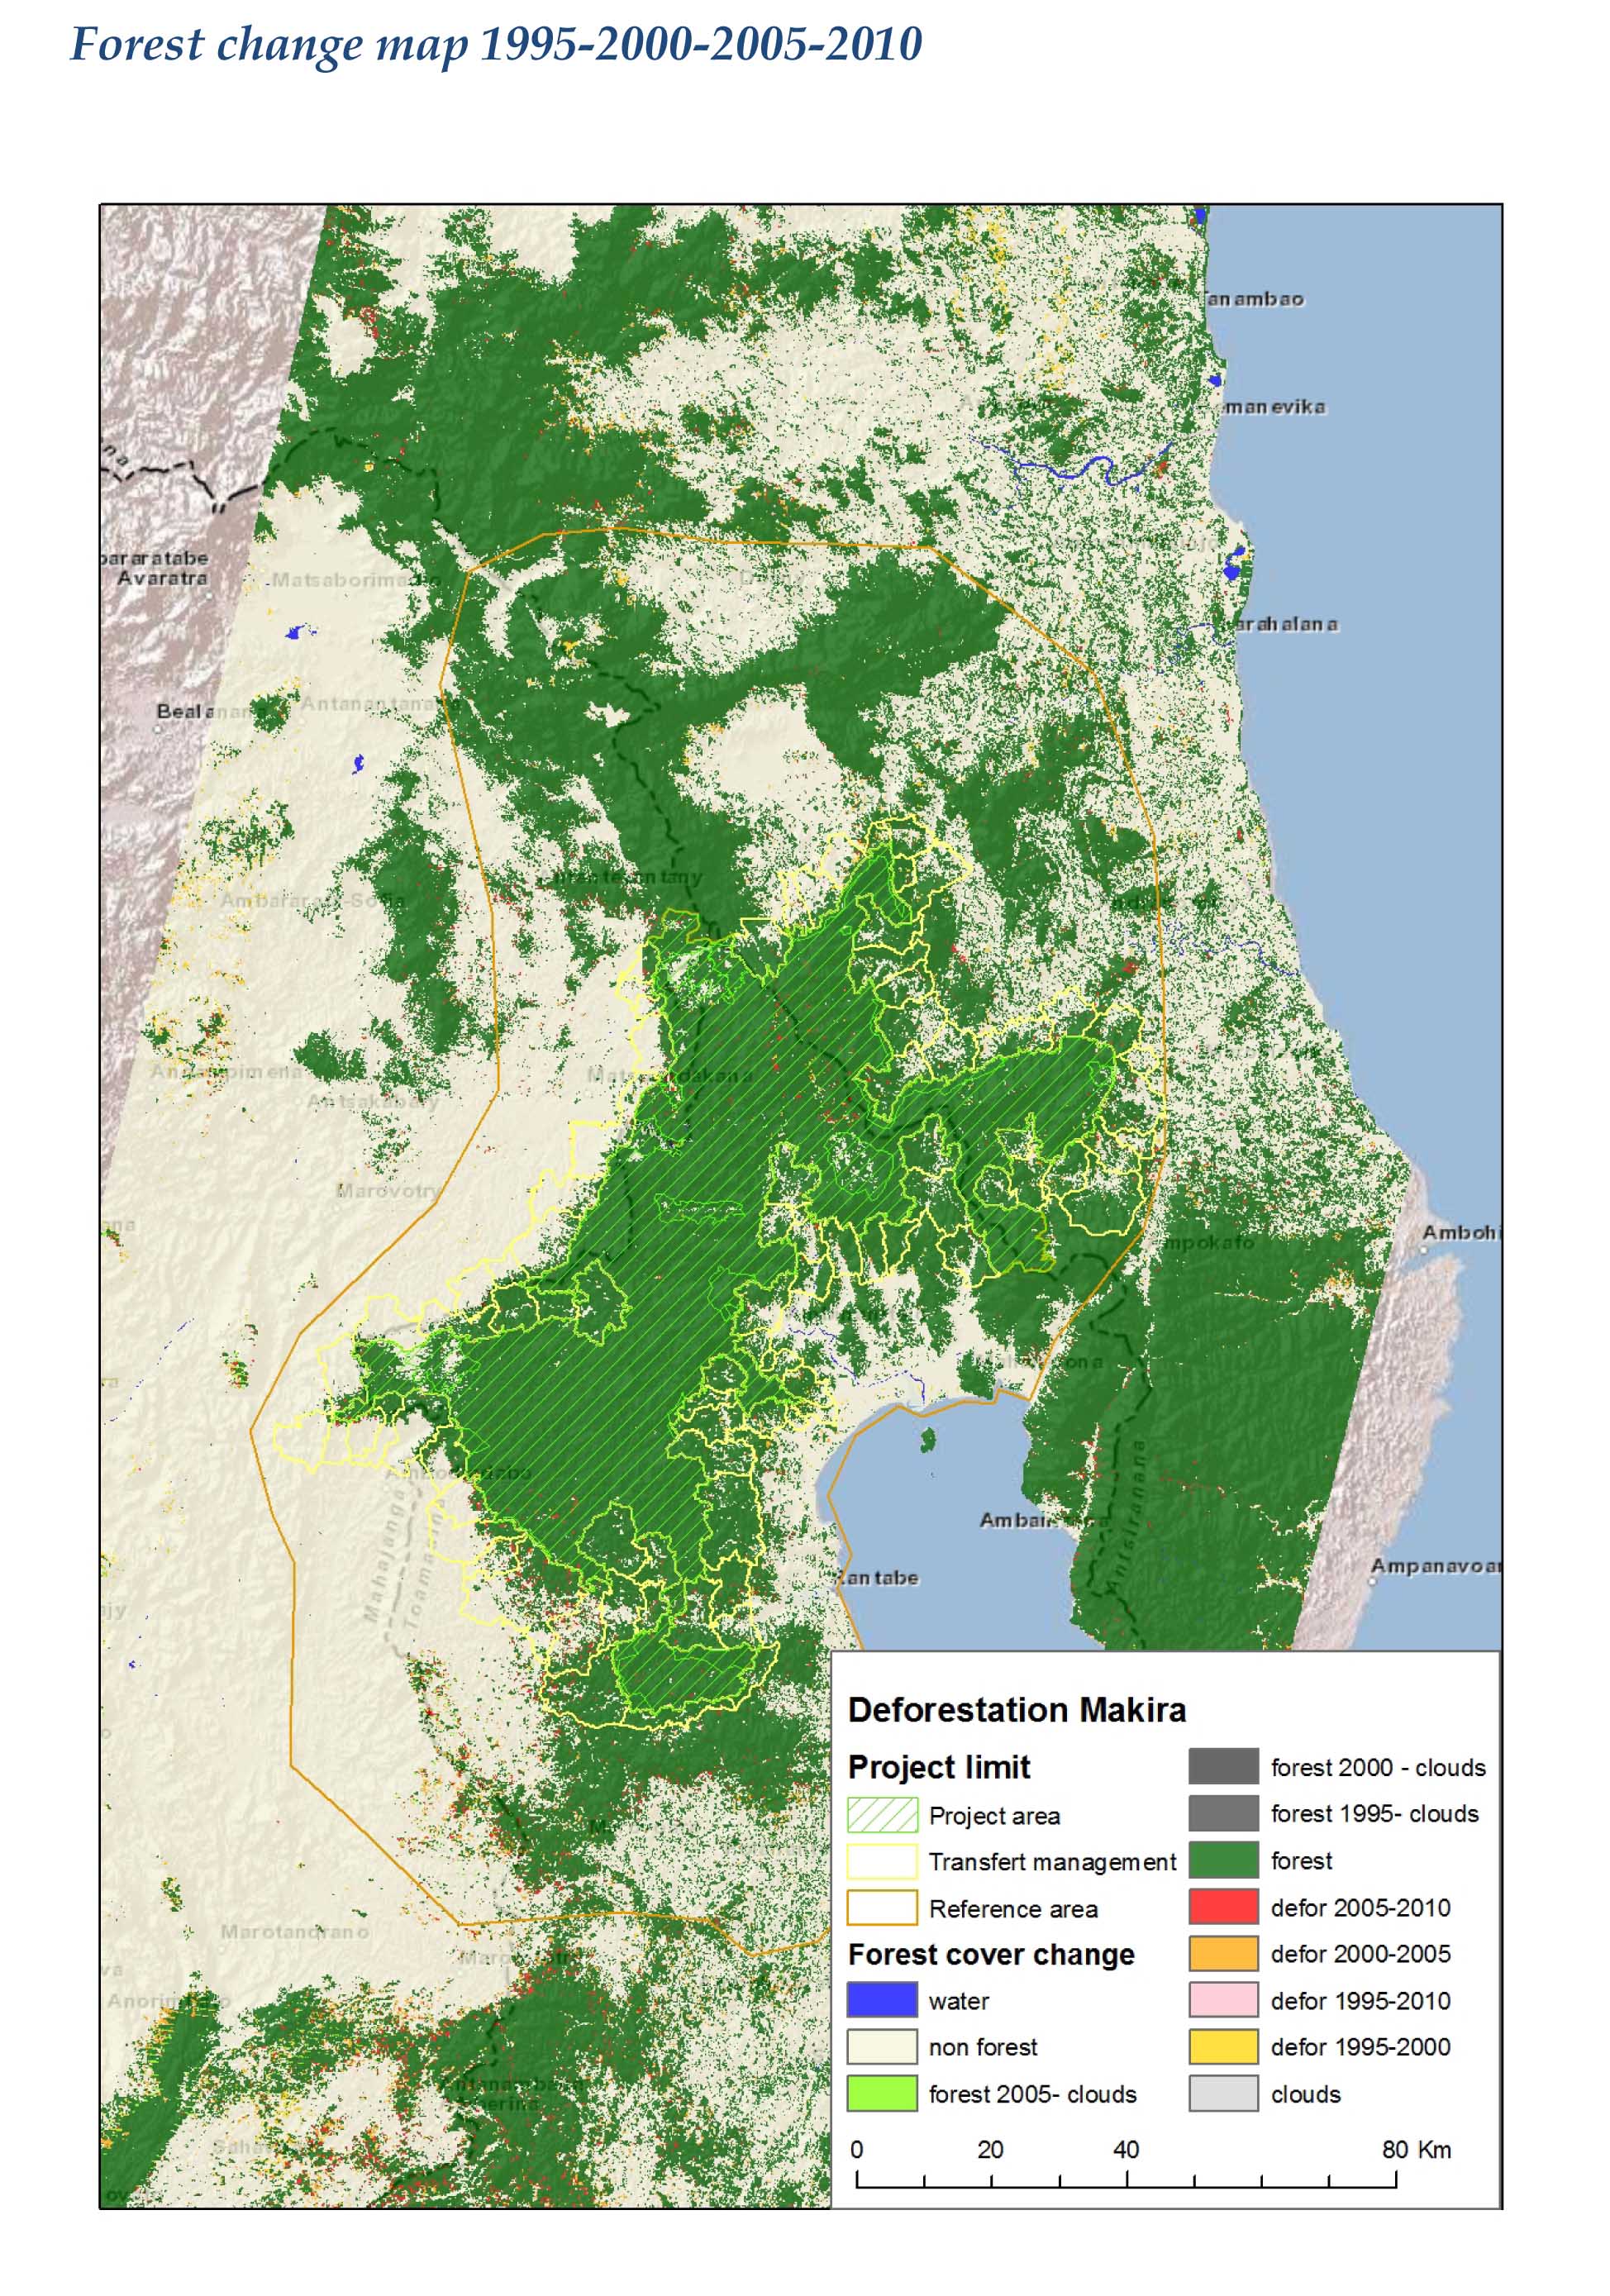
This analysis has been done to establish baseline for a forest carbon project. It consist in analyzing historical deforestation and from there, estimate or model future amount and location of deforestation. Combined with carbon stock inventory, it is possible to estimate past and future greenhouse gas emission due to deforestation. Based on estimated efficiency of the project, future scenario with project emission has also been modeled. This map has been created using mid-resolution satellite imagery for the main work (Landsat images) and high resolution images for validation (RapidEye). This analysis has been validated by international expert in the Carbon trading market (Verified carbon standard)
Localisation map
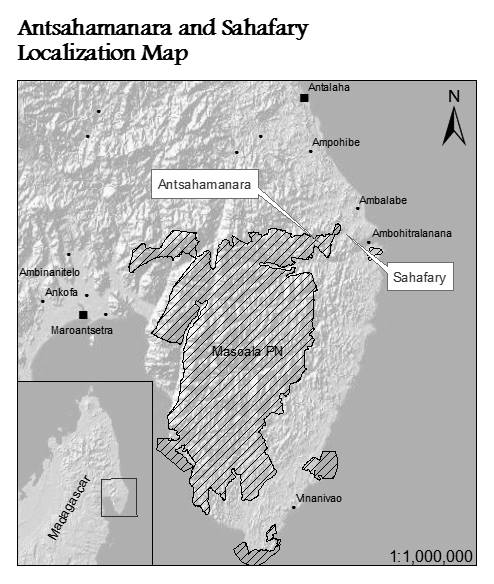
This illustration was created for an author of a scientific article to be published in lemur news. Journal specification were followed, meaning the map has to be grayscale, and the map would be printed in a small area, so the information that can be put in the map are limited for readability.
Land use map
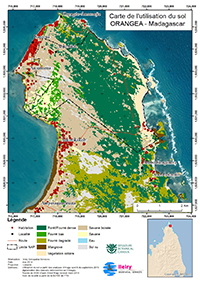
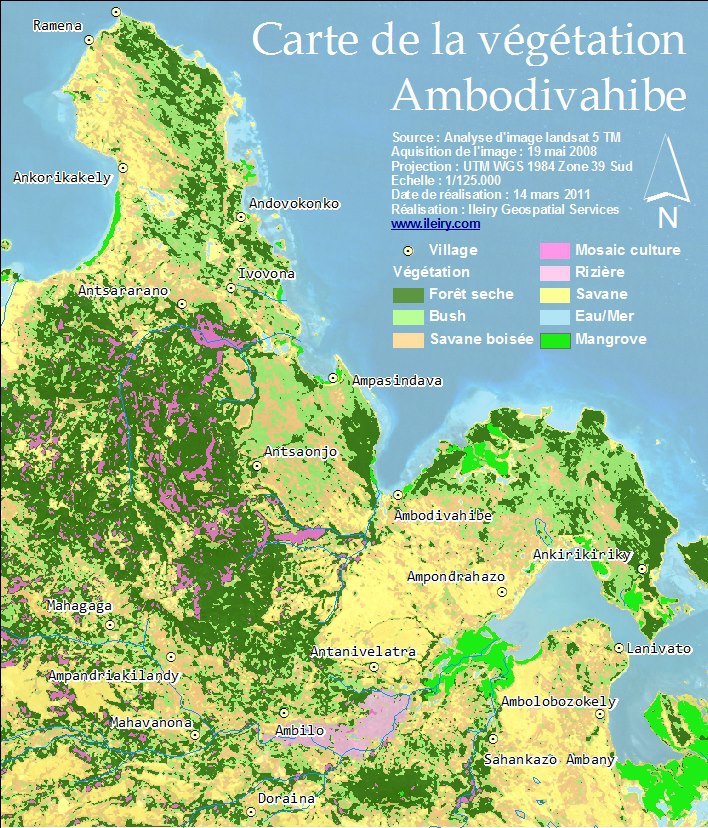
This next map was created for a consultant, who analyzed timber and non timber forest product (NTFP) availability in northern Madagascar. The map was created from a Landsat analysis, and the analysis tried to distinguish different land use type. For this analysis to show contrast on vegetation types, images from dry season was used, showing subtle difference between evergreen forest, deciduous and semi-deciduous ones. Dry season also helps minimize the greenness saturation of the NDVI, part of the parameter analyzed to obtain this land use map.